Indicator 4: Bollinger Bands
Settings: 20,2,Close
Measures: Overbought, oversold conditions
It may seem odd that we are essentially, using the Bollinger. Bands twice in the system, once with the Keltner Channels to define the squeeze and again here. However they have two distinct uses.
Anyone who has used oscillators know the concept of overbought and oversold conditions. Oscillators attempt to tell us when price is relatively oversold or overbought compared to recent history. Once these conditions are met, then we are taught to look for a reversal in price.
It is my view however, and the view of other well known traders, that these signals are no better than a 50/50 bet, through back testing has proven this time and time again. Like I read the other day, even a broken clock is right twice a day. All is not lost however with this mode of trading, it is acknowledged that oscillators work better in ranging conditions, and they also work better if you only take the signals in relation to the trend, for example only trade oversold signals in an up trend.
We can tell when the market is in ranging conditions through our use of the RMMA as mentioned earlier, but I have found oscillators struggle to provide overbought signals in a strong down trend, and oversold signals in a strong up trending market.
So instead I like to use the Bollinger Bands, overlayed directly onto price to find those overbought and oversold areas. Illustration 5 shows the correlation between the Bollinger Bands and a default Stochastic Oscillator. At times they give you a little extra, such as on the 9th of May below where the Stochastic is showing oversold conditions but we are not at the upper Bollinger Band.
Once the trend direction is established via the RMMA, we can look for signs of reversals at the appropriate Bollinger Band, if the trend is up, we look for long triggers at the bottom Bollinger Band and vise versa. If the market is ranging, or directionless, we can think about trading both sides of the Bollinger Bands until a sign of a trend is evident.


Now that we know all the components, let’s put them all together on the one chart and see what we can find out. Illustration 6 shows the same charts as before, but with all the indicators together.
I have marked all the different components that make up the Not So Squeezy trading system, remember there is a reason for each indicator on this chart, see if you can remember what component of the market each is attempting to measure.
It so happened that while writing the manual, the market happened to be in a nice up trend, you can see through the separation of the rainbow how easy this is to see, the longer term moving averages (in purple) are clearly sloping up and well separated, as are the middle averages in red, showing the underlying strength of the trend. This is a classic example of a current not worth swimming against.
There are four clear trading opportunities in the above chart, all of which would have turned a nice little profit with some very basic money management rules. See if you can find them, look for trending conditions, oversold areas and areas where the market has stopped to think and you will find all four opportunities.
The following pages contain various charts of different markets and time frames and conditions, see if you can find the trading opportunities in these charts. At the end of the
document are the same charts with what I consider to be good trades, importantly this does not mean they are always successful trades, but rather trades that have sound logic behind them.
Some may want to take these principals and extend them to different trading conditions, such as counter-trend trading for example. I have one condition if this is done, let me know because it is doing my head in! :)
A link to where you can find the indicators for this system for Metatrader 4 http://www.metaquotes.net is at the end of this document.


Now that we have the framework for knowing when a good trade is approaching, how do we know when to pull the trigger. When do we enter a trade long or short, what gives
us the reason to push that buy or sell button?
Hindsight is a wonderful thing, and looking at historical charts, such as the those on the previous few pages, is a great way to help your brain process the various repeatable patterns that form each day in the marketplace. However what it also does is trick you into thinking you will be able to spot those turning points in real time, when trading off the right edge of the screen instead of from the middle, and it isn’t until live trading that you realise, just like a sporting event, that things look much different live.
Unless you have an established criteria for actually pulling the trigger, the pressure of time will become to great and you will make hasty trading decisions that, on balance will
most likely prove disastrous.
There are many different ways of identifying when to enter and exit a trade, and the Not So Squeezy framework can let you know when the time is approaching to enter a trade, but we need to know when to actually hit that magic button. I will put forward a couple of techniques that I have used with this system, but really the trigger you choose should be the one you are most comfortable with.
Trigger Type 1: 50CCI
The Commodity Channel Index (CCI) indicator is probably made famous most by a chap named Woodie, who trades without any price bars, using only a combination of three different CCI indicators http:// www.woodiescciclub.com
In essence the CCI is simply a representation of price in relation to the moving average specified in the CCI settings. A cross of the zero line corresponds to price crossing the 50EMA, a move to the 200 line show price has burst away from the moving average a long way and is perhaps due for a correction. I would recommend having a look at woodies site and others for all the different trigger types.
Illustration 7 again is the same chart from before, this time with the 50CCI shown and triggers labelled. You can

Measures: Overbought, oversold conditions
It may seem odd that we are essentially, using the Bollinger. Bands twice in the system, once with the Keltner Channels to define the squeeze and again here. However they have two distinct uses.
Anyone who has used oscillators know the concept of overbought and oversold conditions. Oscillators attempt to tell us when price is relatively oversold or overbought compared to recent history. Once these conditions are met, then we are taught to look for a reversal in price.
It is my view however, and the view of other well known traders, that these signals are no better than a 50/50 bet, through back testing has proven this time and time again. Like I read the other day, even a broken clock is right twice a day. All is not lost however with this mode of trading, it is acknowledged that oscillators work better in ranging conditions, and they also work better if you only take the signals in relation to the trend, for example only trade oversold signals in an up trend.
We can tell when the market is in ranging conditions through our use of the RMMA as mentioned earlier, but I have found oscillators struggle to provide overbought signals in a strong down trend, and oversold signals in a strong up trending market.
So instead I like to use the Bollinger Bands, overlayed directly onto price to find those overbought and oversold areas. Illustration 5 shows the correlation between the Bollinger Bands and a default Stochastic Oscillator. At times they give you a little extra, such as on the 9th of May below where the Stochastic is showing oversold conditions but we are not at the upper Bollinger Band.
Once the trend direction is established via the RMMA, we can look for signs of reversals at the appropriate Bollinger Band, if the trend is up, we look for long triggers at the bottom Bollinger Band and vise versa. If the market is ranging, or directionless, we can think about trading both sides of the Bollinger Bands until a sign of a trend is evident.


Putting it All Together
Now that we know all the components, let’s put them all together on the one chart and see what we can find out. Illustration 6 shows the same charts as before, but with all the indicators together.
I have marked all the different components that make up the Not So Squeezy trading system, remember there is a reason for each indicator on this chart, see if you can remember what component of the market each is attempting to measure.
It so happened that while writing the manual, the market happened to be in a nice up trend, you can see through the separation of the rainbow how easy this is to see, the longer term moving averages (in purple) are clearly sloping up and well separated, as are the middle averages in red, showing the underlying strength of the trend. This is a classic example of a current not worth swimming against.
There are four clear trading opportunities in the above chart, all of which would have turned a nice little profit with some very basic money management rules. See if you can find them, look for trending conditions, oversold areas and areas where the market has stopped to think and you will find all four opportunities.
The following pages contain various charts of different markets and time frames and conditions, see if you can find the trading opportunities in these charts. At the end of the
document are the same charts with what I consider to be good trades, importantly this does not mean they are always successful trades, but rather trades that have sound logic behind them.
Some may want to take these principals and extend them to different trading conditions, such as counter-trend trading for example. I have one condition if this is done, let me know because it is doing my head in! :)
A link to where you can find the indicators for this system for Metatrader 4 http://www.metaquotes.net is at the end of this document.


Triggers / Entries
Now that we have the framework for knowing when a good trade is approaching, how do we know when to pull the trigger. When do we enter a trade long or short, what gives
us the reason to push that buy or sell button?
Hindsight is a wonderful thing, and looking at historical charts, such as the those on the previous few pages, is a great way to help your brain process the various repeatable patterns that form each day in the marketplace. However what it also does is trick you into thinking you will be able to spot those turning points in real time, when trading off the right edge of the screen instead of from the middle, and it isn’t until live trading that you realise, just like a sporting event, that things look much different live.
Unless you have an established criteria for actually pulling the trigger, the pressure of time will become to great and you will make hasty trading decisions that, on balance will
most likely prove disastrous.
There are many different ways of identifying when to enter and exit a trade, and the Not So Squeezy framework can let you know when the time is approaching to enter a trade, but we need to know when to actually hit that magic button. I will put forward a couple of techniques that I have used with this system, but really the trigger you choose should be the one you are most comfortable with.
Trigger Type 1: 50CCI
The Commodity Channel Index (CCI) indicator is probably made famous most by a chap named Woodie, who trades without any price bars, using only a combination of three different CCI indicators http:// www.woodiescciclub.com
In essence the CCI is simply a representation of price in relation to the moving average specified in the CCI settings. A cross of the zero line corresponds to price crossing the 50EMA, a move to the 200 line show price has burst away from the moving average a long way and is perhaps due for a correction. I would recommend having a look at woodies site and others for all the different trigger types.
Illustration 7 again is the same chart from before, this time with the 50CCI shown and triggers labelled. You can


see where the triggers and moves correspond. The 50CCI can provide some reliable signals, however in a fast moving market, it can lag behind price a fair way such as the zero line cross at the end of the below chart.
If you want an indicator to tell you when to pull the trigger, the CCI can be a handy tool. Whether you use the 50CCI or another setting is up to you, Woodie uses a 14 and a 6 I believe, so see which one gives you the best results.
The most basic of triggers, and perhaps the most reliable when learnt properly is price itself. In recent times the most popular way to read price action is through candlestick charts.
Candlesticks charts are essentially no different to traditional bar charts, other than the fact that each period of time is shown in a different, easier to read format. No new information is presented through a candlestick chart, but the idea is that it is quicker and easier to read that information. From my experience I cannot argue against that idea.
There are a multitude of different candlestick formations out there that are supposed to give a bullish or bearish signal when completed. A nice basic rundown of candlesticks can be found at http://www.hotcandlestick.com/ while a list of different formation can be found at http://www.litwick.com/glossary.html
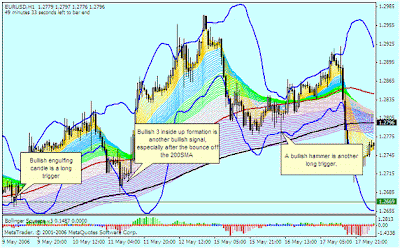
Let’s look at Illustration 8, yep the same chart again (sorry if you are sick of it!), but instead of taking the CCI as our trigger, let’s look for some candlestick formations instead. These are but only a small sample of the different formations that exist, but it should give you an idea.
The first long signal marked is a bullish engulfing candle. This is where the body of the bull candle is somewhat larger, and more than covers that of the preceding bear candle. The fact this happened at the same time as a squeeze signal, at the lower Bollinger Band and it closed above the 100SMA, is a very strong trigger signal to go long with the prevailing trend.
The second is a more advanced formation call the Bullish 3 inside up formation, where we have two inside days (where the entire candle is contained within the preceding candle) right above the 200SMA and at the lower Bollinger Band (remember it is an indication of oversold conditions).
The third is a basic single candle formation called a bullish hammer, where the body is very small, with a long lower wick. This shows there was an attempt to push prices lower, but they were quickly rejected. Again this is at the lower Bollinger Band, and we have a squeeze signal, so time to go long.
These are only three of the many other formations out there, for the astute reader, you would notice that there are a fair few counter trend formations that form at the upper Bollinger Band as well, this is a more advanced method of trading this system that I myself don’t feel comfortable with, but explore it at your leisure. These are just two trigger methods, try to find yours.

If you want an indicator to tell you when to pull the trigger, the CCI can be a handy tool. Whether you use the 50CCI or another setting is up to you, Woodie uses a 14 and a 6 I believe, so see which one gives you the best results.
Trigger Type 2: Candlestick Formations
The most basic of triggers, and perhaps the most reliable when learnt properly is price itself. In recent times the most popular way to read price action is through candlestick charts.
Candlesticks charts are essentially no different to traditional bar charts, other than the fact that each period of time is shown in a different, easier to read format. No new information is presented through a candlestick chart, but the idea is that it is quicker and easier to read that information. From my experience I cannot argue against that idea.
There are a multitude of different candlestick formations out there that are supposed to give a bullish or bearish signal when completed. A nice basic rundown of candlesticks can be found at http://www.hotcandlestick.com/ while a list of different formation can be found at http://www.litwick.com/glossary.html
Let’s look at Illustration 8, yep the same chart again (sorry if you are sick of it!), but instead of taking the CCI as our trigger, let’s look for some candlestick formations instead. These are but only a small sample of the different formations that exist, but it should give you an idea.
The first long signal marked is a bullish engulfing candle. This is where the body of the bull candle is somewhat larger, and more than covers that of the preceding bear candle. The fact this happened at the same time as a squeeze signal, at the lower Bollinger Band and it closed above the 100SMA, is a very strong trigger signal to go long with the prevailing trend.
The second is a more advanced formation call the Bullish 3 inside up formation, where we have two inside days (where the entire candle is contained within the preceding candle) right above the 200SMA and at the lower Bollinger Band (remember it is an indication of oversold conditions).
The third is a basic single candle formation called a bullish hammer, where the body is very small, with a long lower wick. This shows there was an attempt to push prices lower, but they were quickly rejected. Again this is at the lower Bollinger Band, and we have a squeeze signal, so time to go long.
These are only three of the many other formations out there, for the astute reader, you would notice that there are a fair few counter trend formations that form at the upper Bollinger Band as well, this is a more advanced method of trading this system that I myself don’t feel comfortable with, but explore it at your leisure. These are just two trigger methods, try to find yours.